.
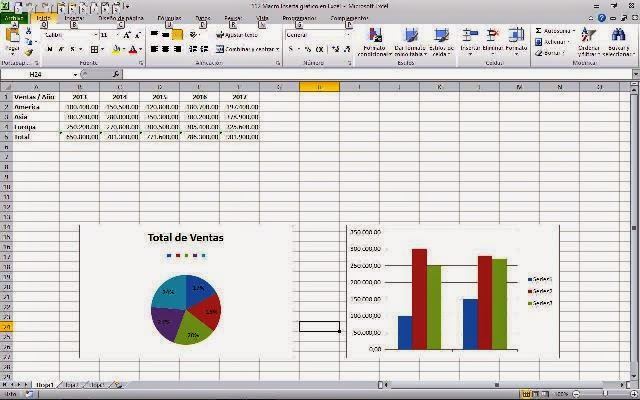
 Una de las cosas más complicadas o requiere mayor trabajo, es insertar un gráfico o Chart mediante una macro o procedimiento de VBA, en este ejemplo se insertan dos gráficos, uno de Torta y otro de barra, todo mediante macros, a esto se le adiciona la determinación del rango de datos en forma automática, lo cual transforma el ejemplo más que interesante.
 Al final existe un link desde el cual podrás descargar el archivo de ejemplo y adaptarlo a lo que requieras, el ejemplo lo que hace es agregar mediante macro un gráfico de torta y otro de barras.
if (payload.eventType == ‘subscribe’) {
// Add code to handle subscribe event.
} else if (payload.eventType == ‘unsubscribe’) {
// Add code to handle unsubscribe event.
}
if (window.console) { // for debugging only
window.console.log(‘YT event: ‘, payload);
}
}
Sub InsertaGraf()
On Error Resume Next
Application.ScreenUpdating = FalseDim pf, uf As Integer
Dim wc, r, r1, uc As String
b = ActiveSheet.Name
pf = 2
uf = Sheets(b).Range(«B» & Rows.Count).End(xlUp).Row
uc = Sheets(b).Cells(1, Columns.Count).End(xlToLeft).Address
wc = Mid(uc, InStr(uc, «$») + 1, InStr(2, uc, «$») – 2)
r = «B» & pf & «:» & wc & uf – 1
r1 = «B» & uf & «:» & wc & uf
Range(r1).Select
Set myChart = ActiveSheet.ChartObjects.Add(100, 200, 320, 200)
With myChart
.Chart.SetSourceData Source:=Selection
.Chart.ChartType = xlPie
.Chart.SeriesCollection(1).XValues = Range(«H2:H4»)
.Chart.ApplyLayout (2)
.Chart.ChartTitle.Select
.Chart.ChartTitle.Text = «Total de Ventas»
End With
Range(r).Select
Set myChart1 = ActiveSheet.ChartObjects.Add(500, 200, 320, 200)
With myChart1
.Chart.SetSourceData Source:=Selection
‘.Chart.ChartType = xlPie
.Chart.SeriesCollection(1).XValues = Range(«H6:H7»)
‘.Chart.ApplyLayout (3)
‘.Chart.ChartTitle.Select
‘.Chart.ChartTitle.Text = «Cód correctos vs. Cód con desviaciones»
End With
Application.ScreenUpdating = True
End Sub
On Error Resume Next
Application.ScreenUpdating = False
Dim pf, uf As Integer
Dim wc, r, r1, uc As String
b = ActiveSheet.Name
pf = 2
uf = Sheets(b).Range(«B» & Rows.Count).End(xlUp).Row
uc = Sheets(b).Cells(1, Columns.Count).End(xlToLeft).Address
wc = Mid(uc, InStr(uc, «$») + 1, InStr(2, uc, «$») – 2)
r = «B» & pf & «:» & wc & uf – 1
r1 = «B» & uf & «:» & wc & uf
Range(r1).Select
Set myChart = ActiveSheet.ChartObjects.Add(100, 200, 320, 200)
With myChart
.Chart.SetSourceData Source:=Selection
.Chart.ChartType = xlPie
.Chart.SeriesCollection(1).XValues = Range(«H2:H4»)
.Chart.ApplyLayout (2)
.Chart.ChartTitle.Select
.Chart.ChartTitle.Text = «Total de Ventas»
End With
Range(r).Select
Set myChart1 = ActiveSheet.ChartObjects.Add(500, 200, 320, 200)
With myChart1
.Chart.SetSourceData Source:=Selection
‘.Chart.ChartType = xlPie
.Chart.SeriesCollection(1).XValues = Range(«H6:H7»)
‘.Chart.ApplyLayout (3)
‘.Chart.ChartTitle.Select
‘.Chart.ChartTitle.Text = «Cód correctos vs. Cód con desviaciones»
End With
Application.ScreenUpdating = True
End Sub
.
>
If this post was helpful INVITE ME A COFFEE and so help keep up the page, CLICK to download free example.
Si te gustó por favor compártelo con tus amigos
If you liked please share it with your friends


